Hej, I'm Oscar.
I'm a Swedish data storyteller. I dig through public data, Eurostat, BLS, Ember, SIPRI, looking for stories, and turn the good ones into charts. I check every number by hand against the primary source, publish the data behind each chart as plain CSV, and build live pages where you can explore it yourself.
I write about what I find in Oscar's Charts, a weekly newsletter where each issue takes on one dataset.
Recent charts
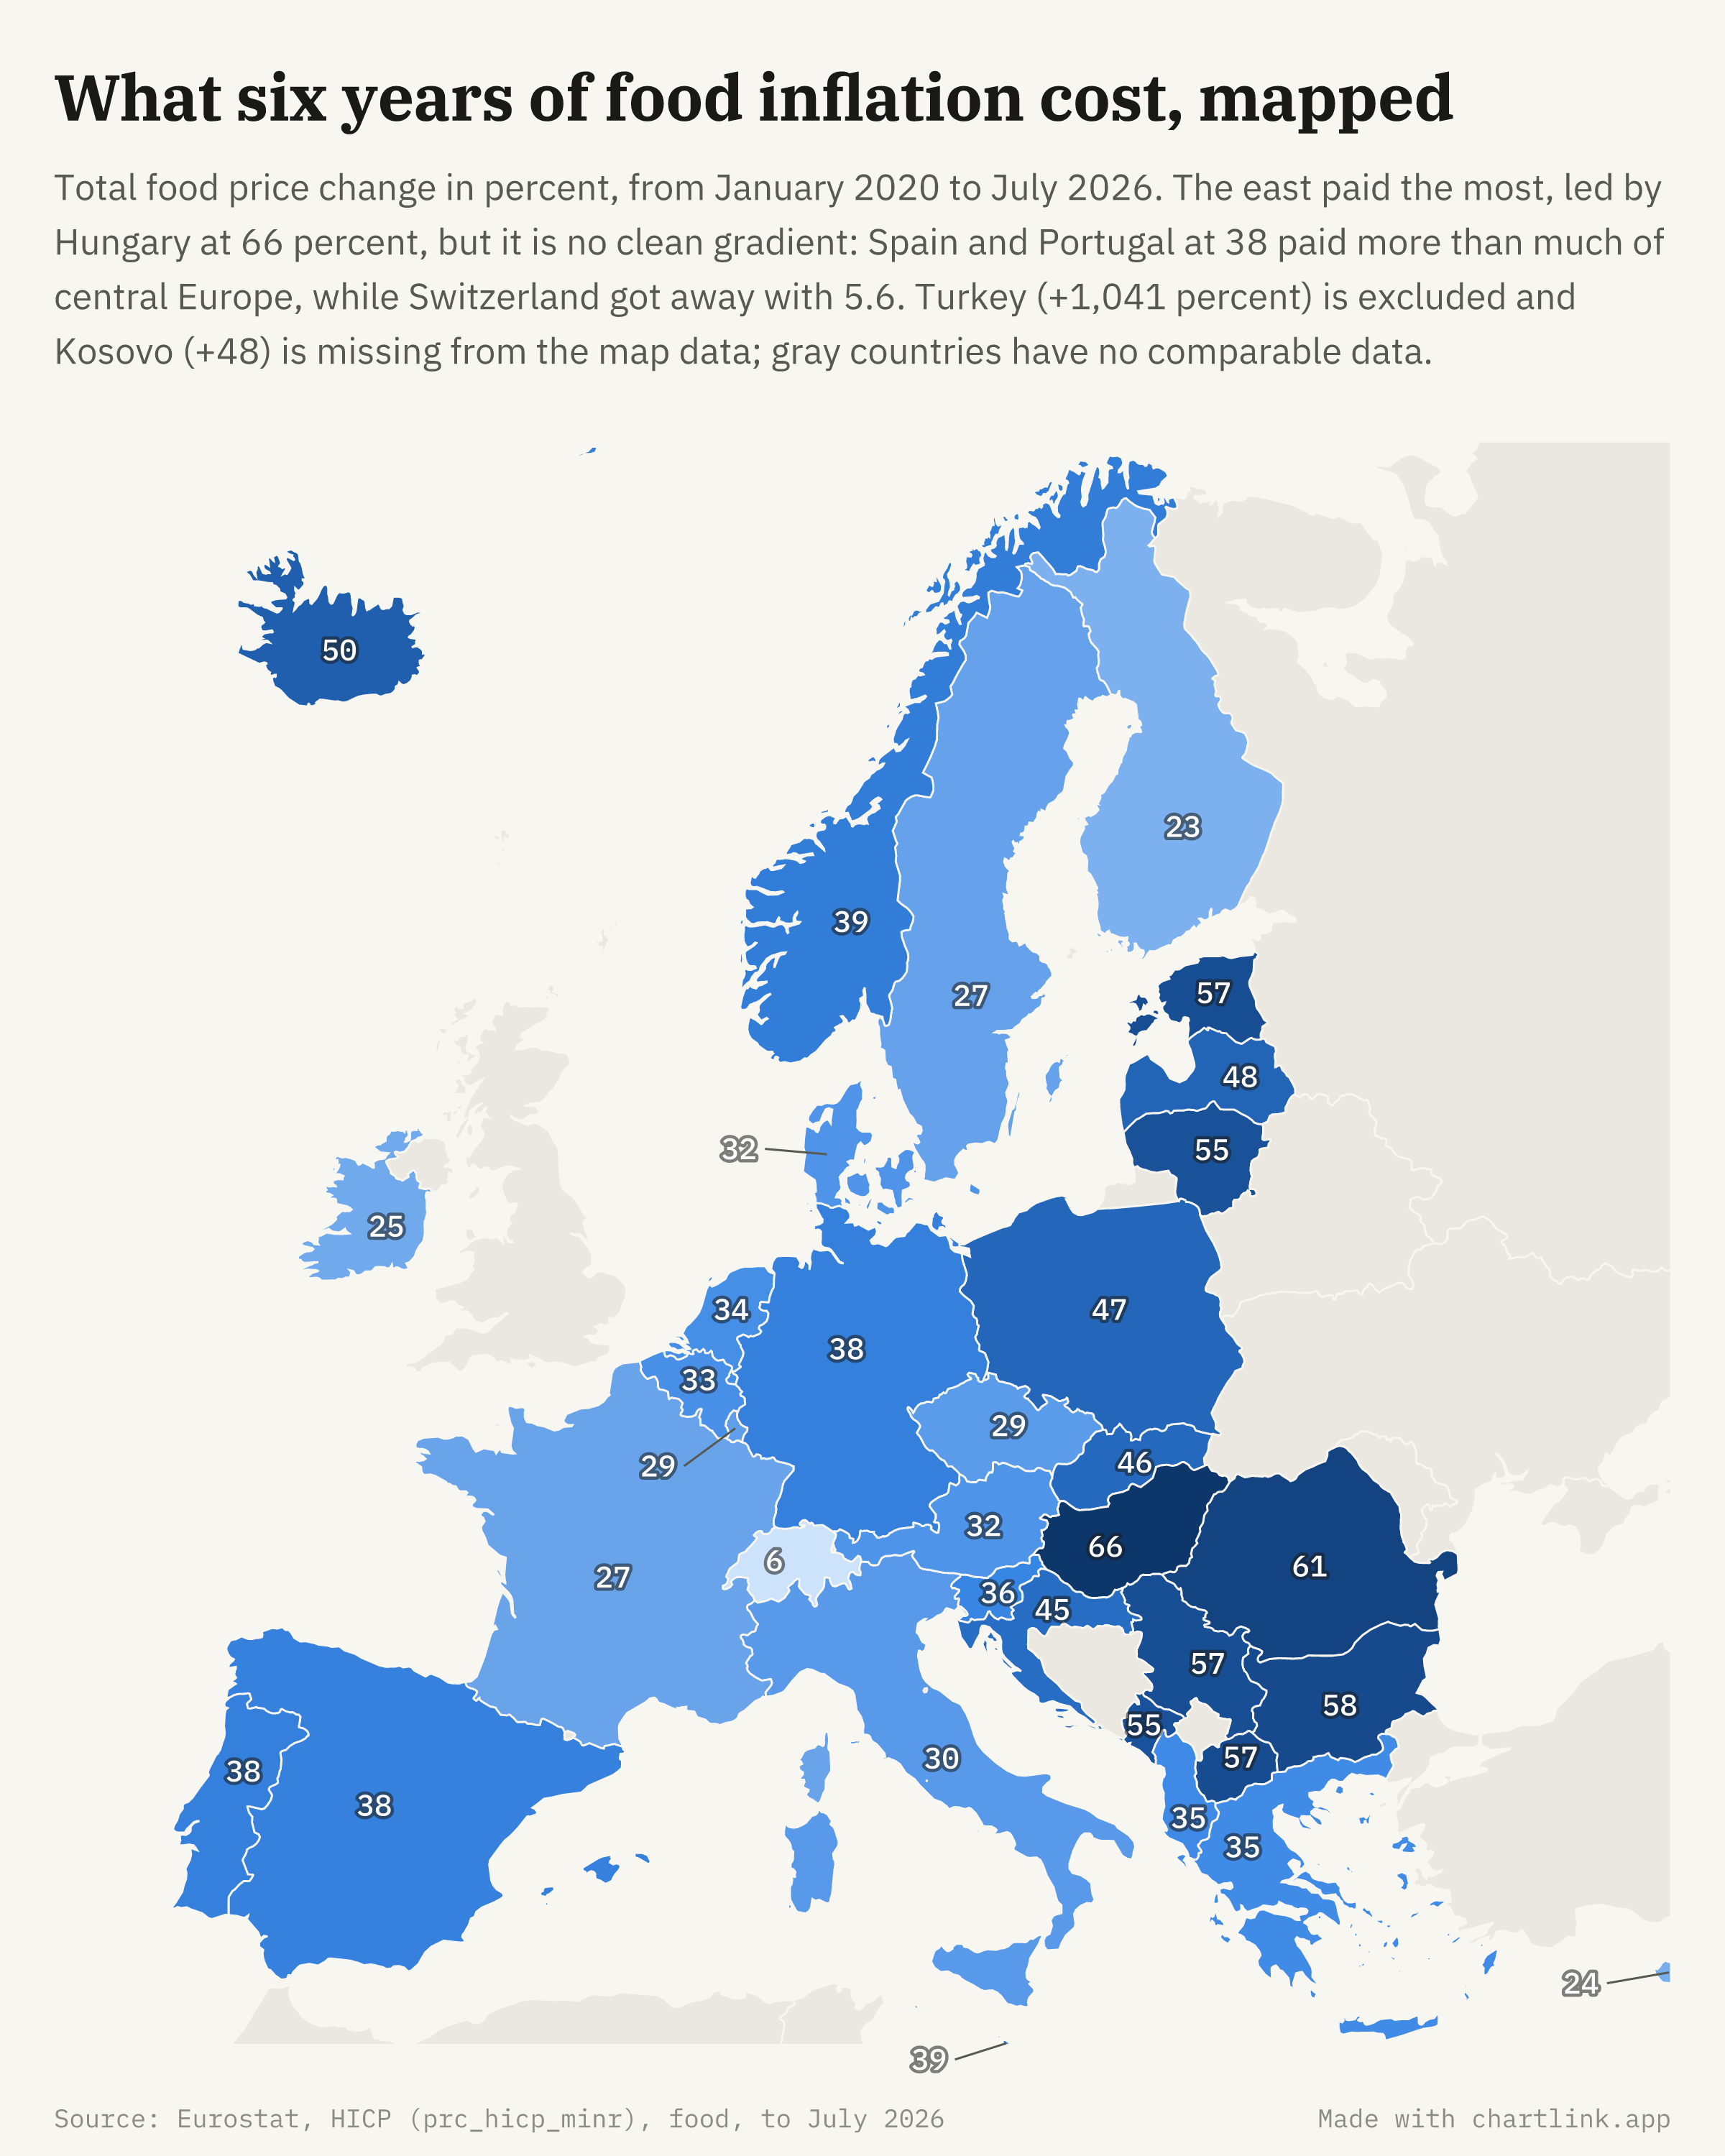
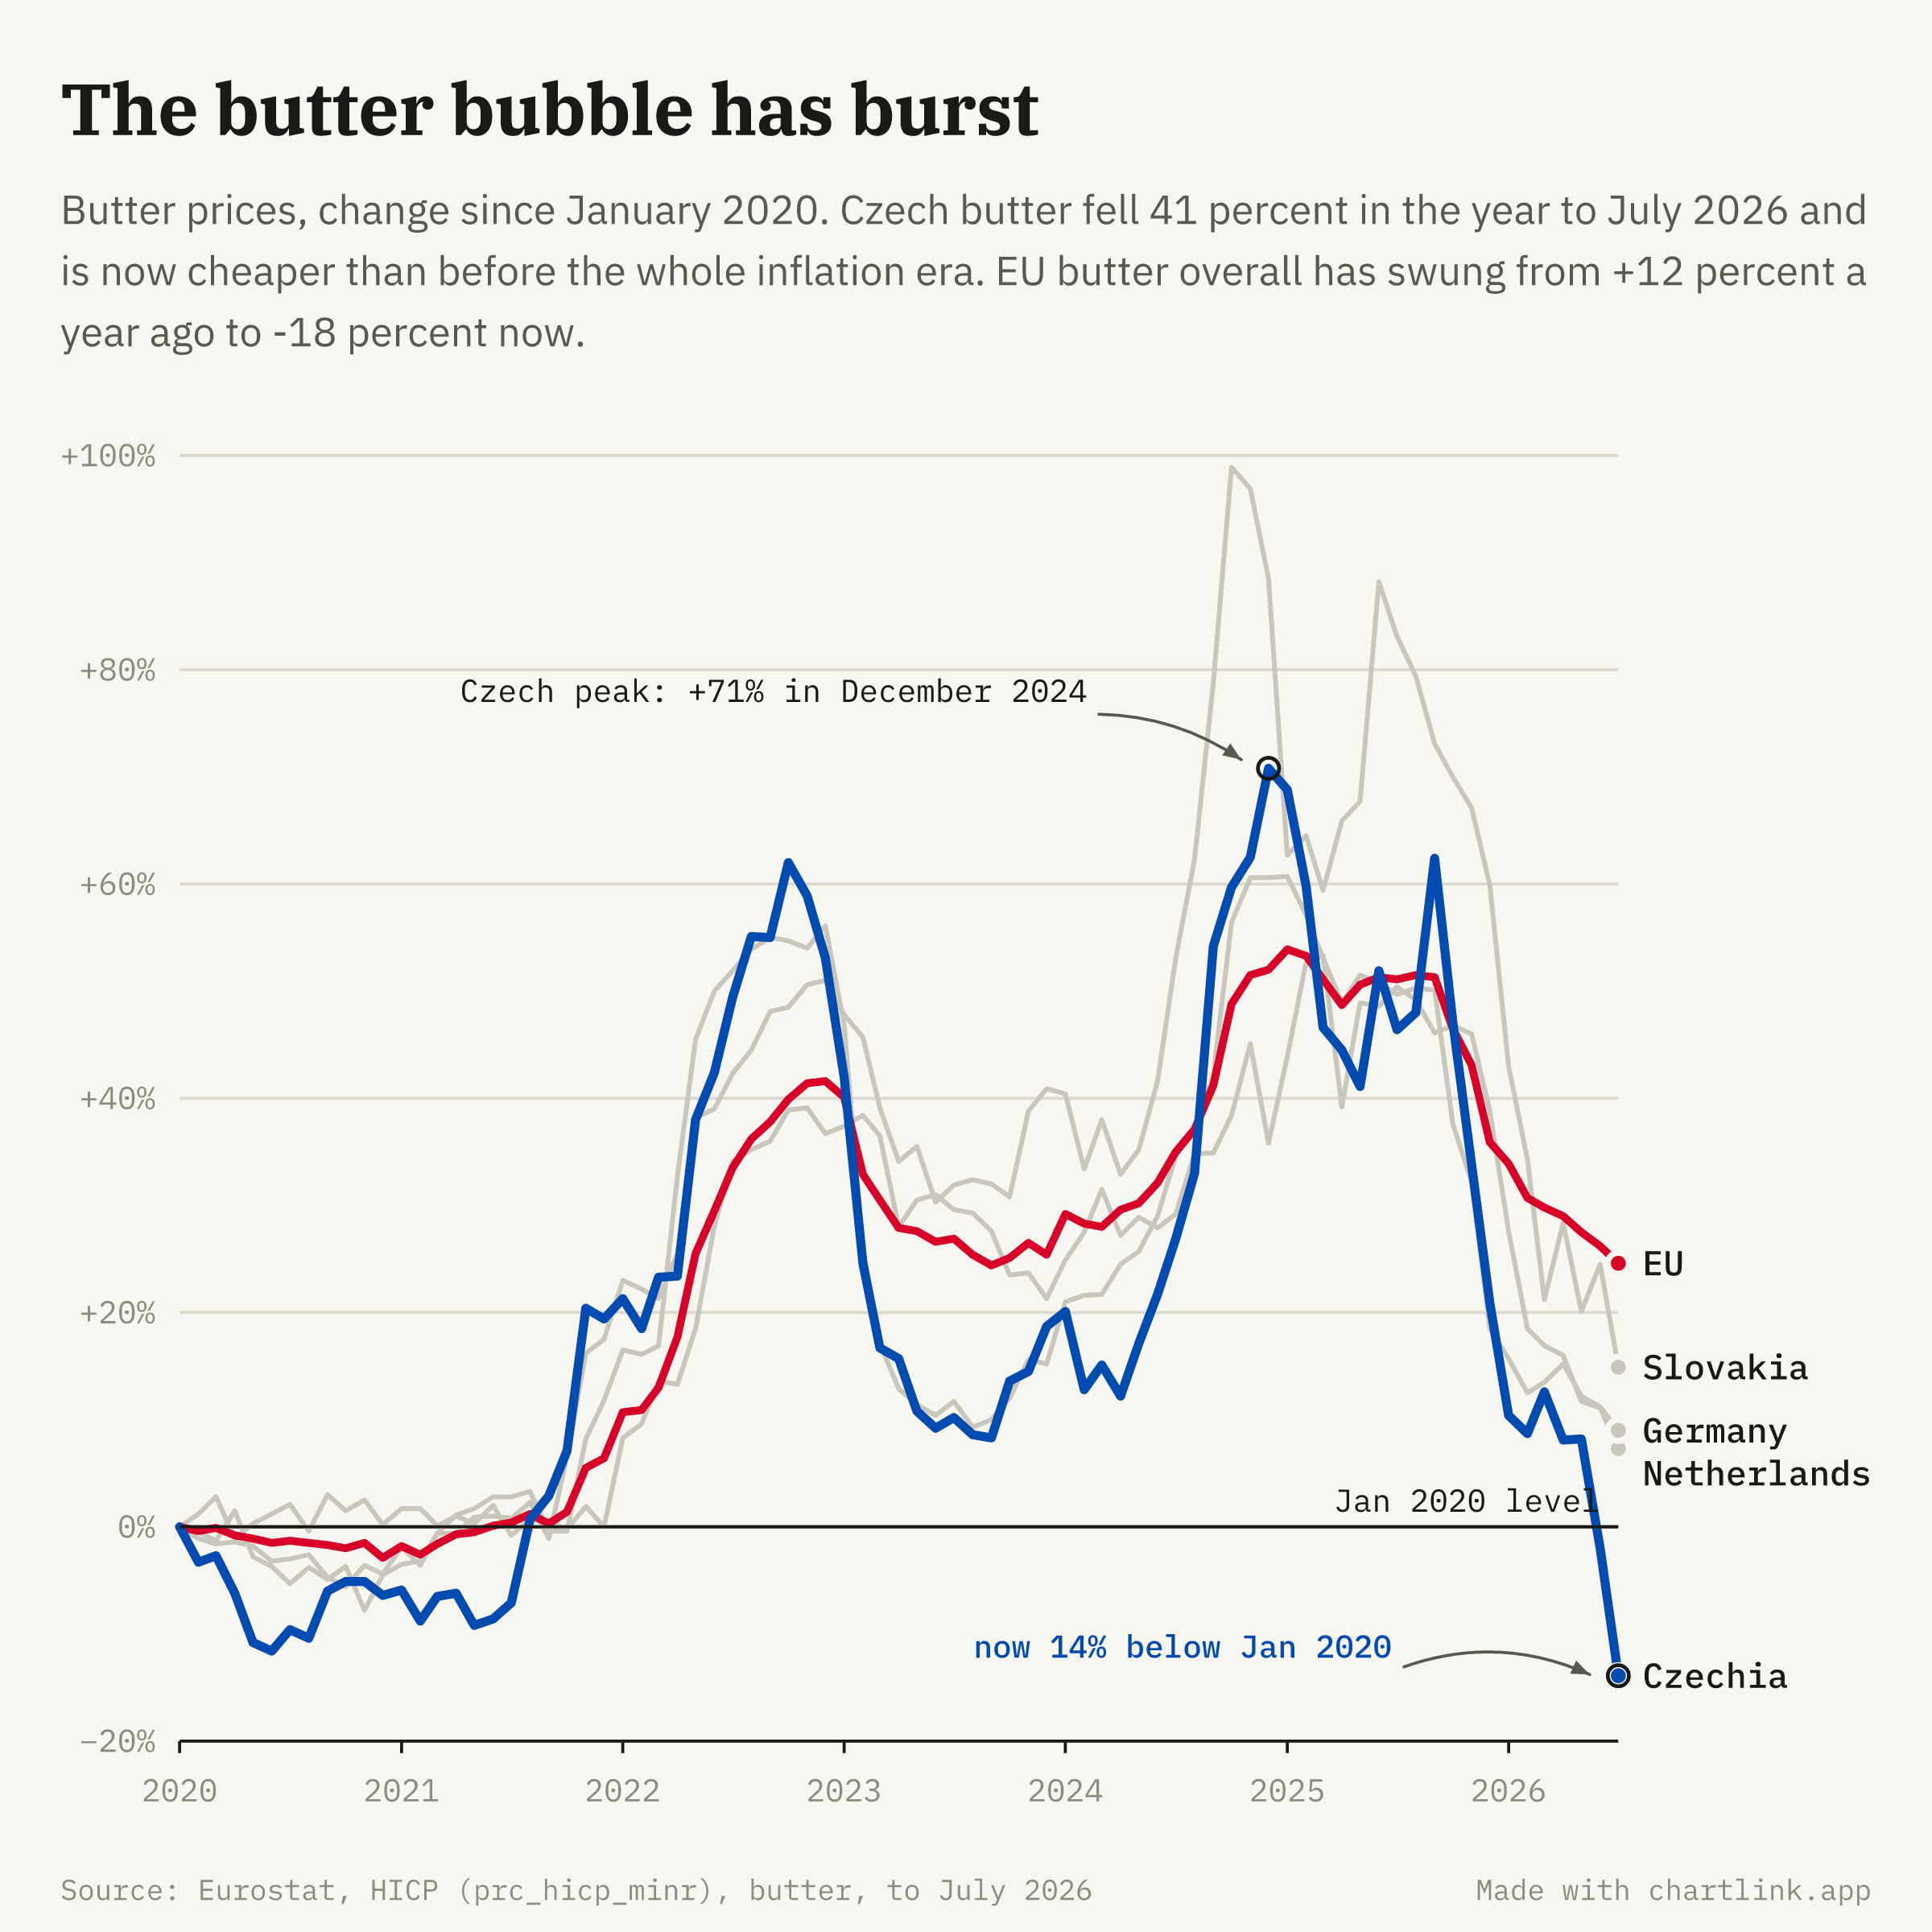
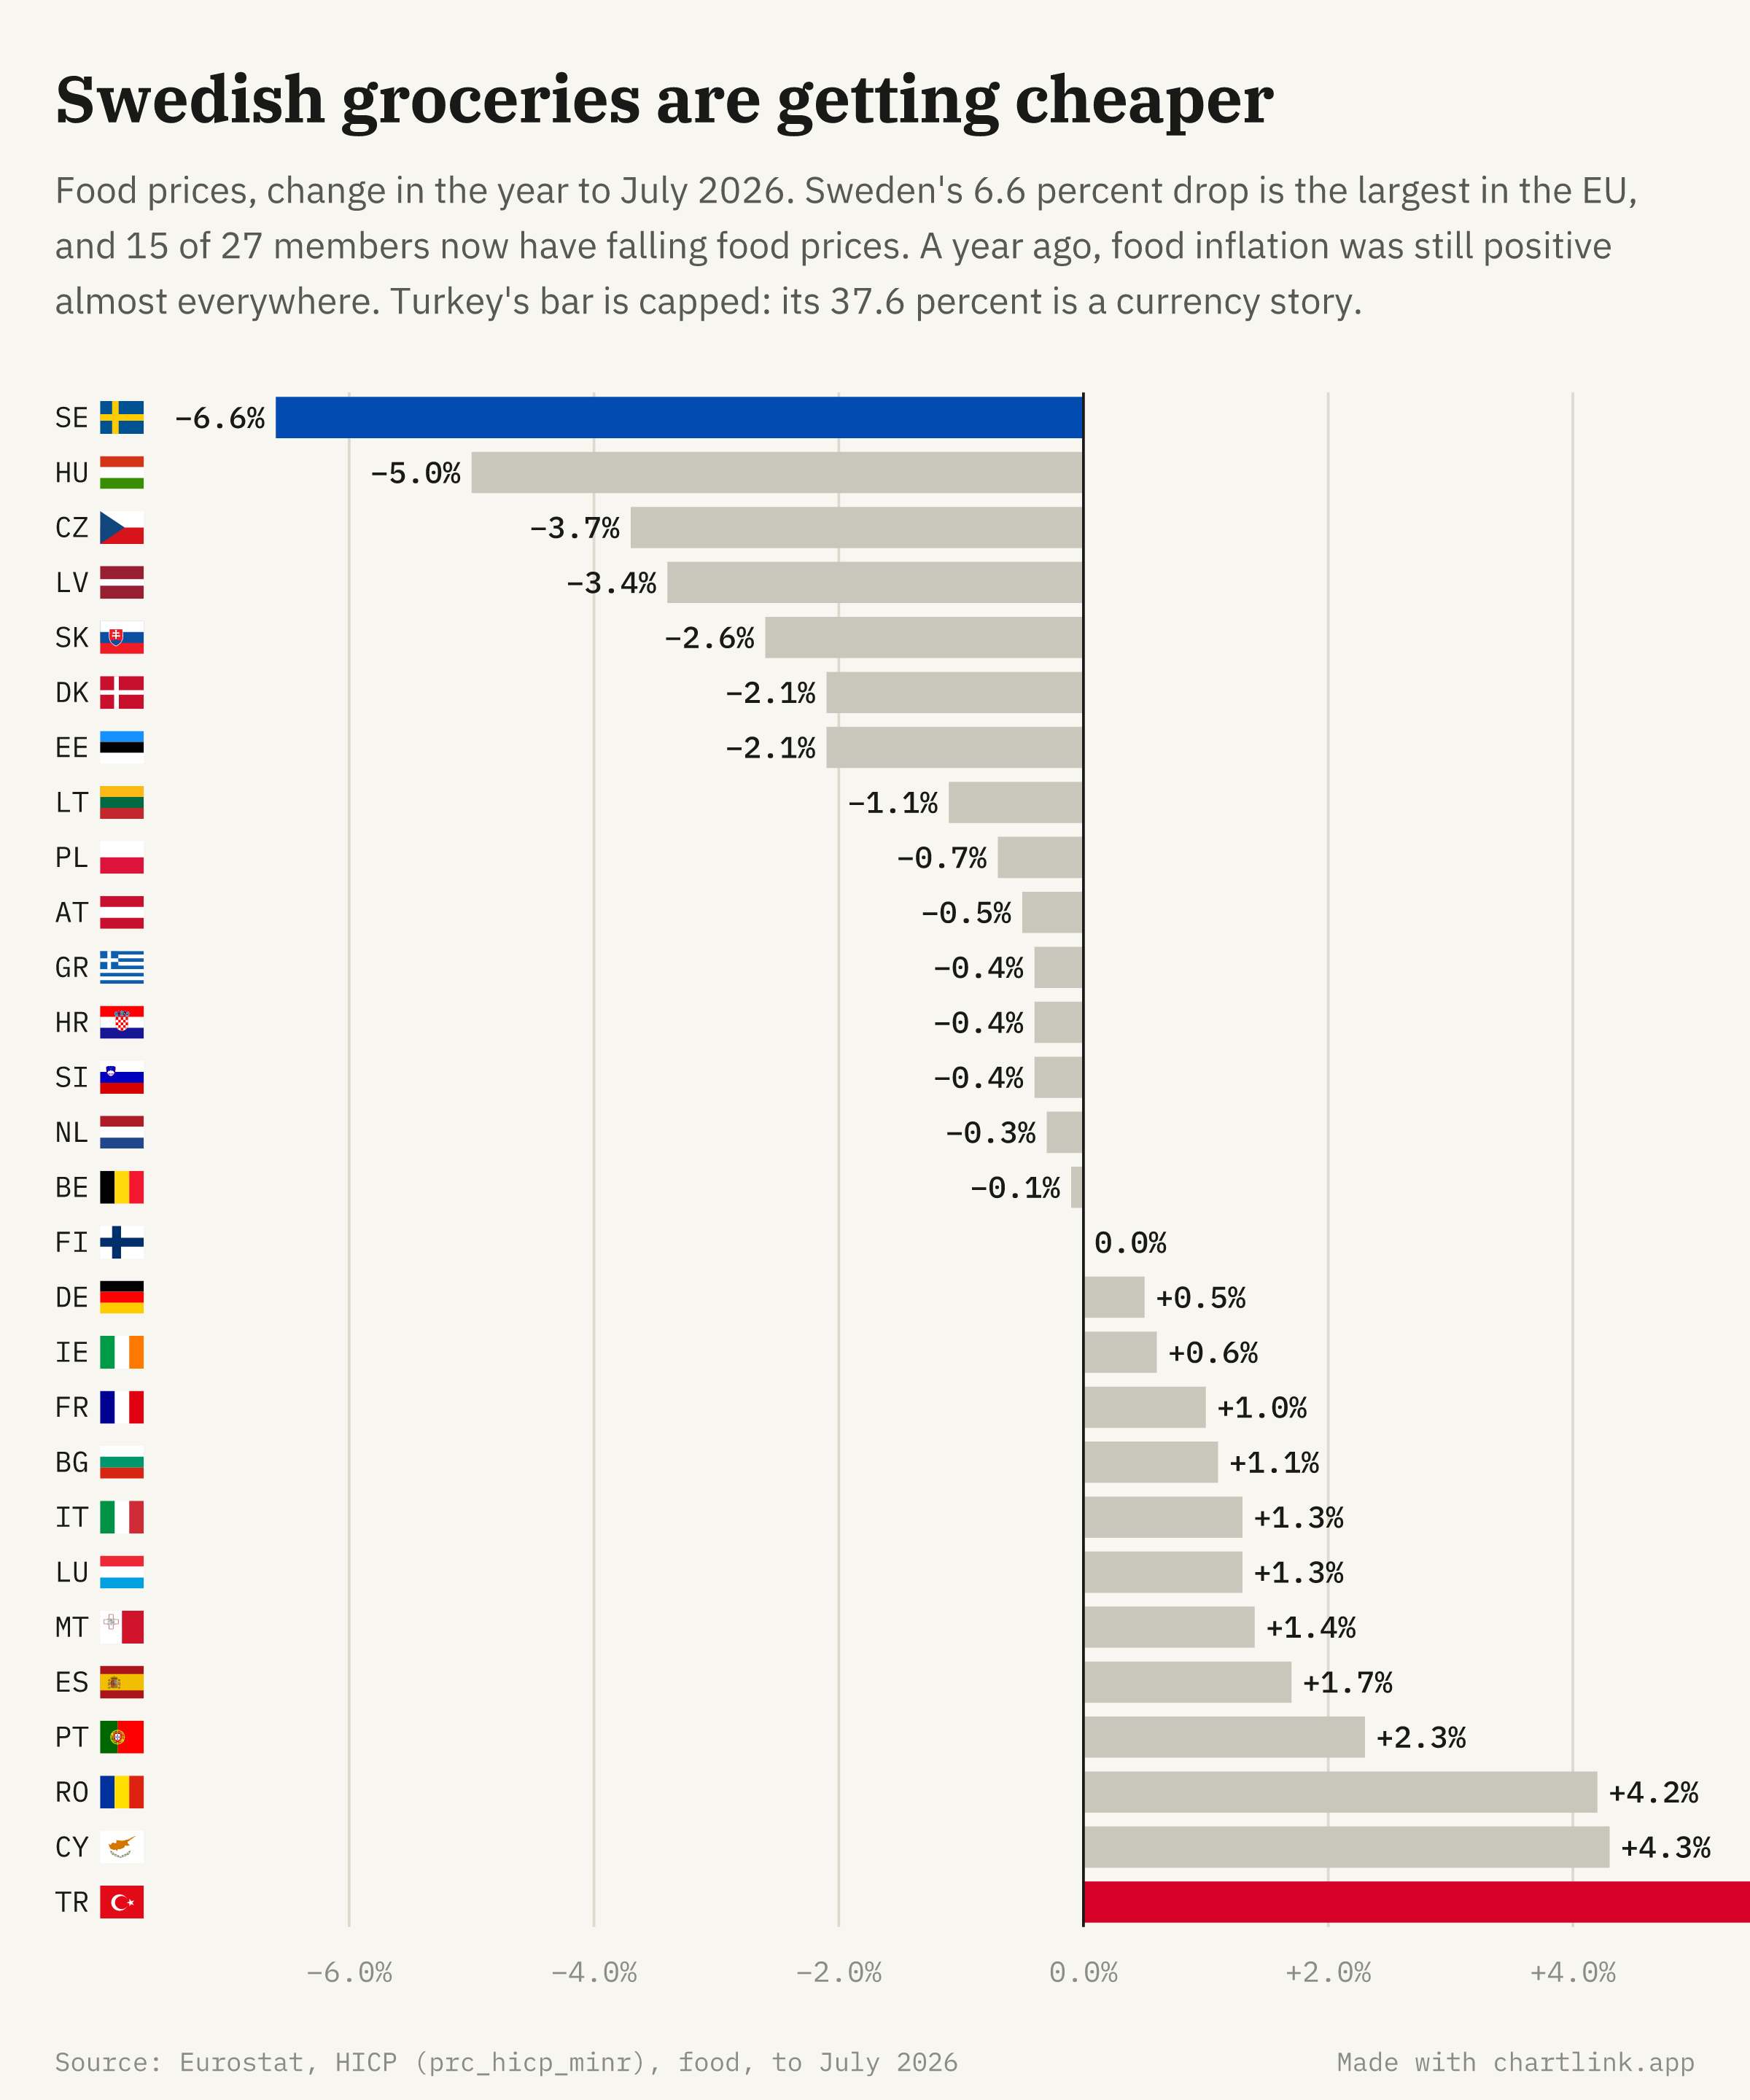
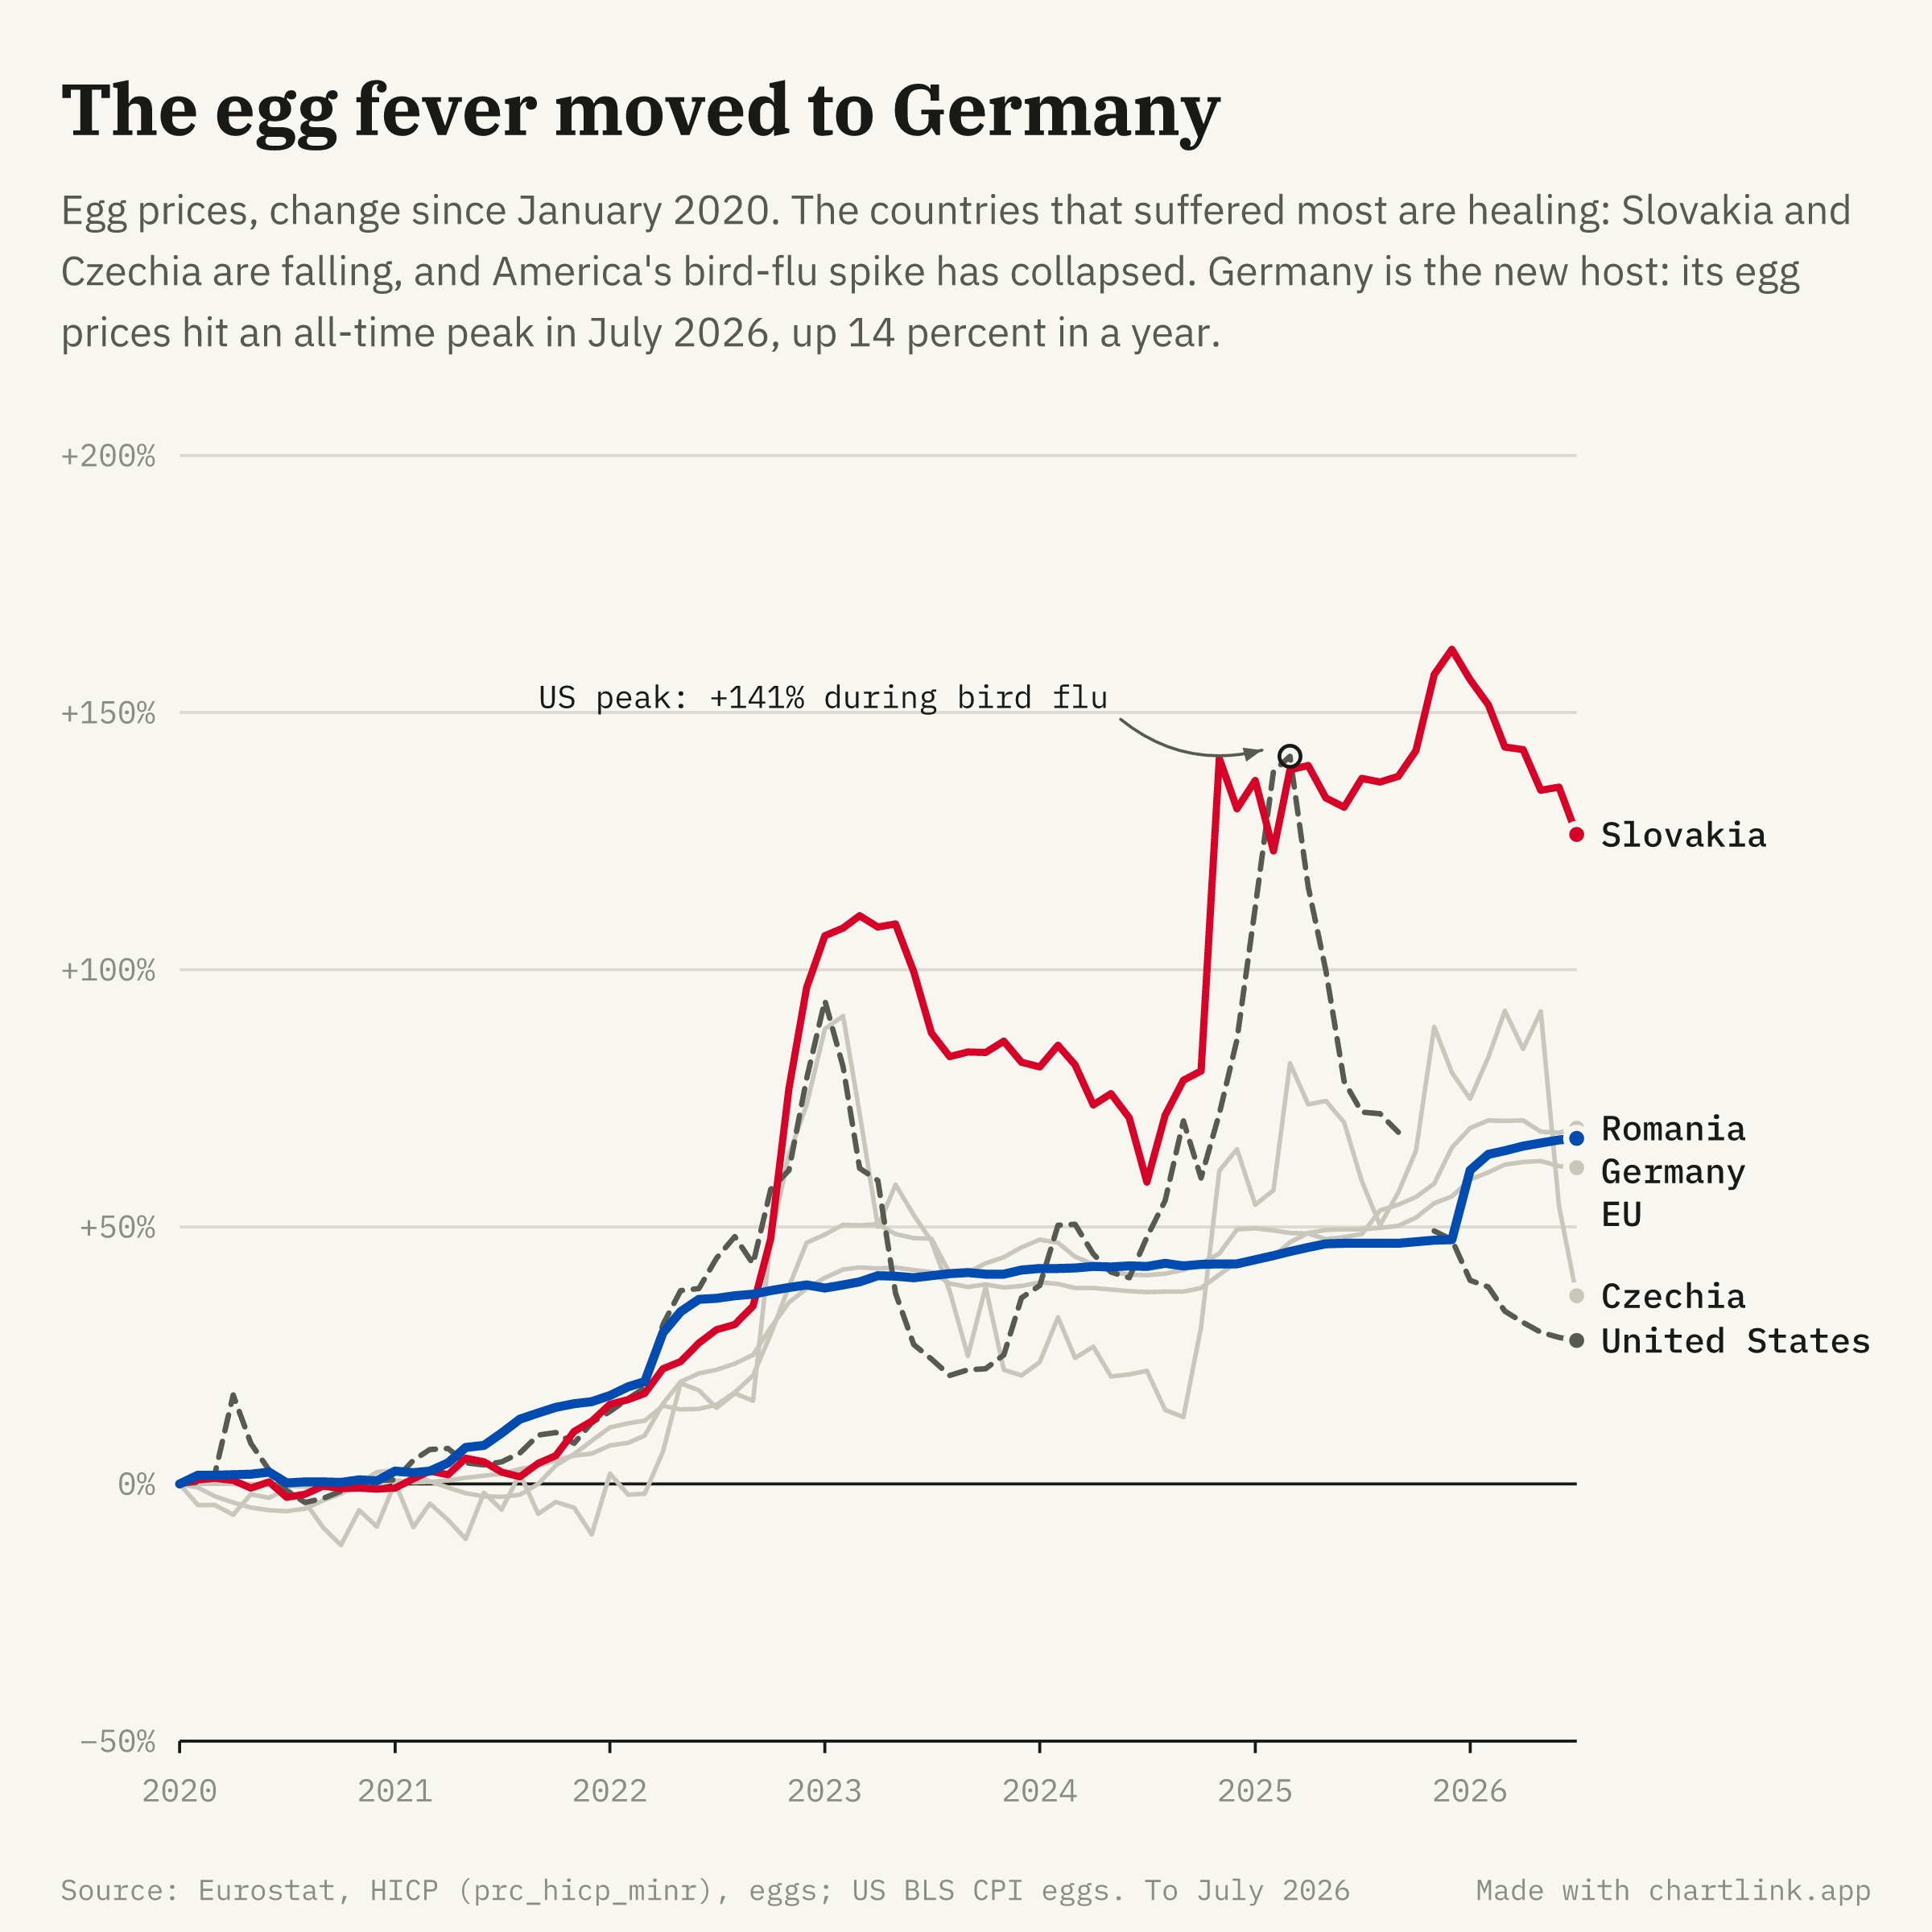
from the current issue on European food prices · charts update themselves when new data lands
Elsewhere
- oscarleo.substack.com · the newsletter
- github.com/oscarleoo/chart-data · the data behind every published chart